Overview
SuperXvue® D-XR software can be integrated with existing information management systems. Furthermore, X-ray images can be evaluated using the SuperXvue® D-XR image diagnostic module included in the acquisition software. Thus, the system functions as a diagnostic workstation.
The patient’s further treatment to be discussed in the consulting room straight after the X-ray was taken. The digital X-ray image diagnostic software for vets is a very helpful tool for orientation purposes and surgical planning. In addition to mere diagnostic evaluation of images, It allows diagnostic reports to be captured and exported. Documents may be attached and exchanged. All diagnostic reports of a patient are always displayed. Individual diagnostic reports of a patient may be selected for exporting and formatted.
Benefits
- Integrated SuperXvue® D-XR image diagnosis, processing, and storage in an SQL database, including image manipulation, export options, layout adjustments, user interface customization and much more…
- PAN, Stepless zoom,Magnification tool, ROI, Crop, Rotate, Mirror etc.
- Insertion of image annotations, e.g. text, arrow, ellipse
- Adjustment of window/level options as well as gamma correction, sharpening filters and noise suppression.
- Measurement of distances, angles, areas and density
- Remote maintenance service available
Hip Dysplasia (HD)
Measurement of Norberg-angle with dogs, less commonly with cats
HOW TO MEASURE
- Place the concentric circles (fh1) over the right femoral head, so that the center of the femoral head is found.
- Place the center of the point (a1) to the edge of the right acetabulum.
- Place the concentric circles (fh2) over the left femoral head, so that the center of the femoral head is found.
- Place the center of the point (a2) to the edge of the left acetabulum.
- Click on the “Calculate” button to start the calculation of the Norberg angle.
NOTE!
You can adjust the placement of the circles and points as often as desired. After correction, the “Calculate” button must not be clicked again.
Figure 1. Calculation of Norberg-angle

Figure 2. Calculation of Norberg-angle
LEGEND
fh1 – circles over the right femoral head
fh2 – circles over the left femoral head
a1 – edge of the right acetabulum
a2 – edge of the left acetabulum
Laminitis Measurement
– Radiological measurements from the feet of horses with relevance to laminitis
REQUIREMNTS
Required radiograph: toe LM
HOW TO MEASURE
- Draw the baseline bl
– Place toe base point bl1
– Place heel base point bl2
- Draw the hoof line hw
– Place the point hw1 for a distal hoof wall
– Place the point hw2 for a proximal hoof wall
- Draw the dp line
– Place the point dp1 for apex distal phalanx
– Place the point dp2 at the proximal limit of the extensor process of the distal phalanx
- Draw the xb line for X-ray beam focus
– To find the points xb1 and xb2 place one circle at the beginning and the second at the end of middle phalanx
NOTE!
You can regulate the size of circles.
The measured values include:
angle S = dorsal hoof wall to ground base line
angle T = dorsal cortex of distal phalanx to ground base line
angle U = axis line of proximal phalanx to ground base line
angle H = T – S
angle R = T – U
FD = Founder Distance = distance between proximal hoof wall and proximal limit of the Extensor Process of the distal phalanx
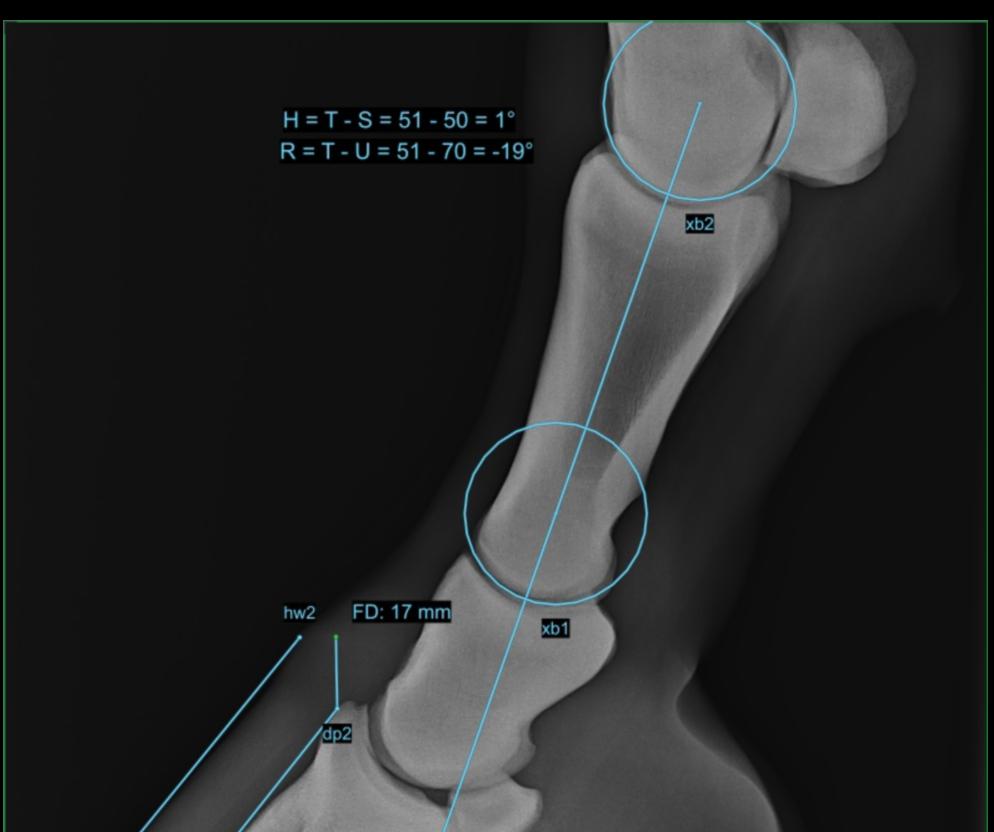
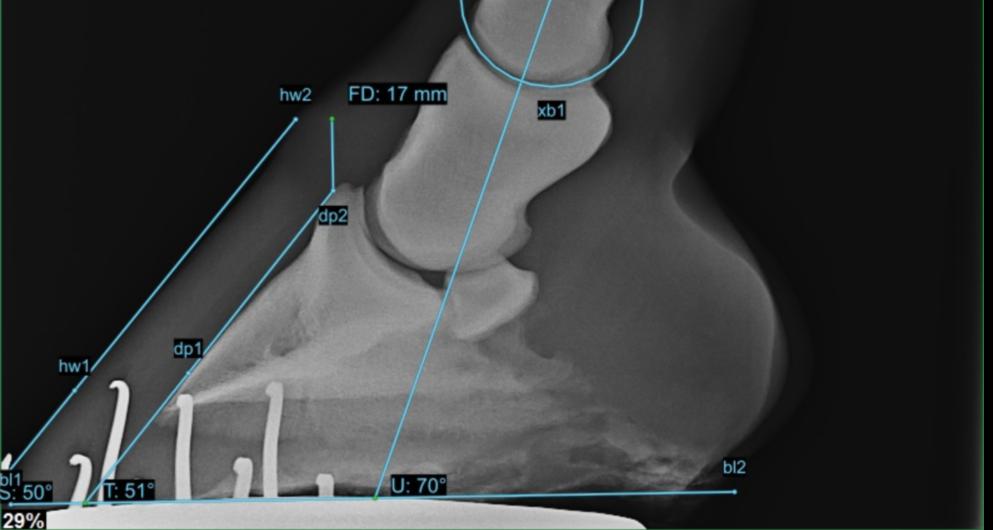
Figure 1. Laminitis measurement
LEGEND
FD = Founder Distance
hw1 = distal hoof wall
hw2 = proximal hoof wall (skin-horn junction)
dp1 = apex distal phalanx
dp2 = proximal limit of the Extensor Process of the distal phalanx
xb = x-ray beam focus
bl1 = toe base line point
bl2 = heel base line point
bl = base line
Tibial Plateau Leveling Osteotomy (TPLO) Measurement
– Measurement of the tibial plateau angle or tibial slope
REQUIREMNTS
Required radiograph: ML views of stifle and hock joint used for the measurement of the tibial plateau angle
NOTE!
– X-ray beam centered at stifle joint and collimated.
– Positioning for these radiographs must ensure that the medial and lateral femoral condyles are superimposed.
HOW TO MEASURE
- Draw line (line 1) between the cranial (p1) and caudal (p2) aspects of the tibial plateau.
- Draw another line (line 2) between the tibial intercondylar tubercles (p3) and the centre of talus (p4).
- At the point of intersection of both lines, a perpendicular line (line 3) is drawn to the line connecting the talus (line 2).
The measured value:
The resulting angle is the tibial plateau angle.
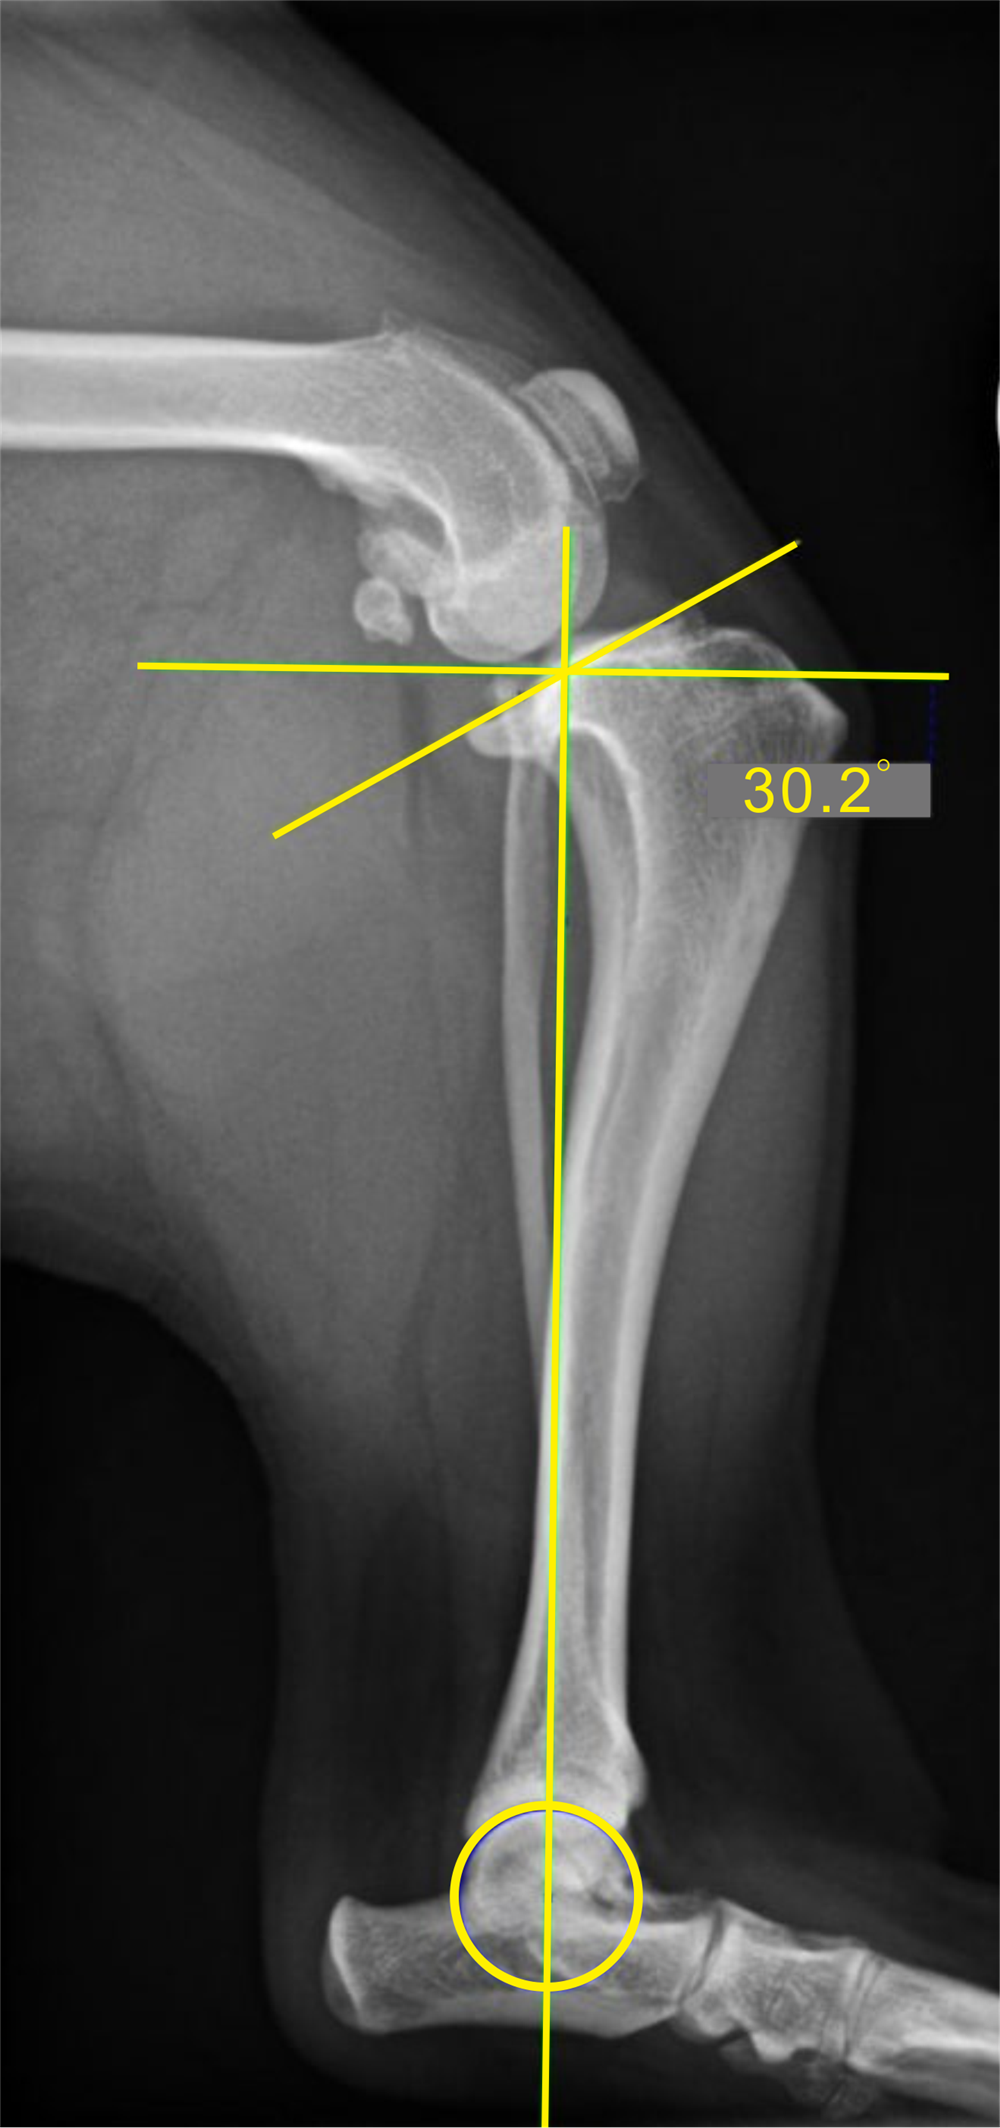
Figure 1. TPLO measurement
LEGEND
p1 = cranial tibial plateau
p2 = caudal tibial plateau
p3 = tibial intercondylar tubercles
p4 = centre corpus talus
line 1: between p1 and p2
line 2: between p3 and p4
line 3: at intersection line 1 and line 2 perpendicular to line 2 (90°)
TPLO angle: between line 1 and line 3
Tibial Tuberosity Advancement (TTA) Measurement
– Use for the common tangent method for determining appropriate advancement cage size
HOW TO MEASURE
- Draw line between central points of two circles fh1 and fh2.
– Place first circle which central point represents surface femur (fh1).
– Place second circle which central point represents surface tibia (fh2).
NOTE!
Two circles are supposed to touch.
- Place the point p1 on apex patella.
- Place the point p2 on tibial tuberosity.
NOTE!
There is a line from the point p1 to distal perpendicular (90°) at common tangent.
Common tangent is a tangential line between 2 circles and perpendicular to tibial plateau slope (line between central points of 2 circles).
These lines are calculated by the software automatically and don’t need be visible.
The measured value:
D – Distance for TTA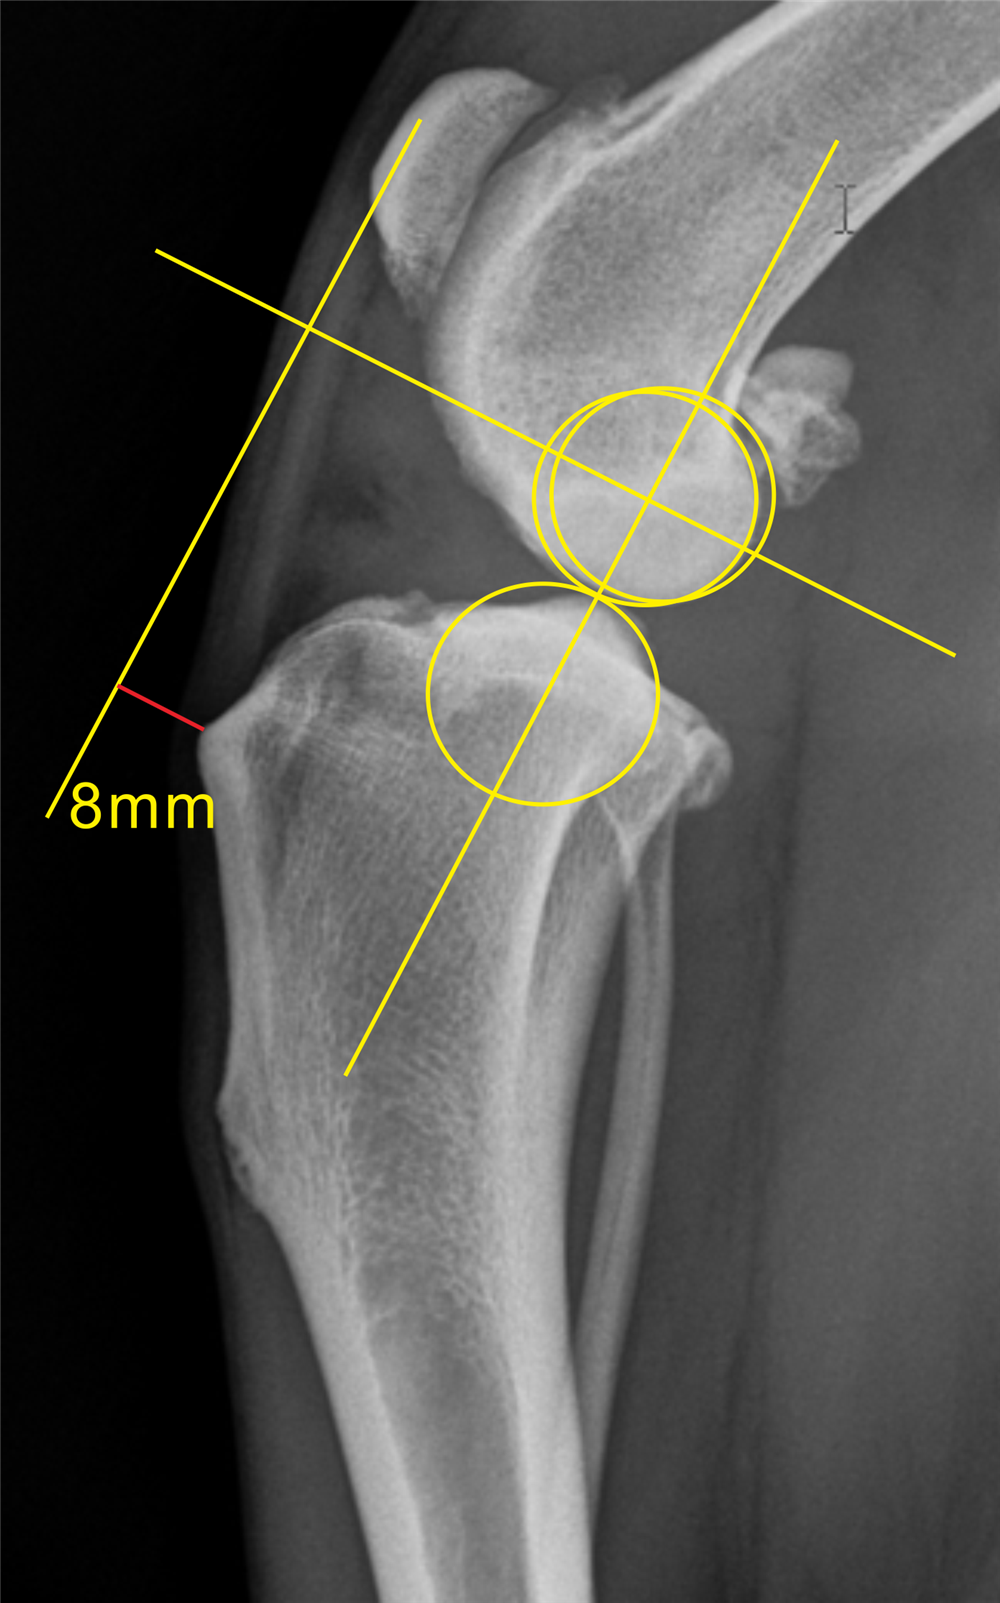
Figure 1. TTA measurement
LEGEND
fh1 = central point circle presents surface femur
fh2 = central point circle presents surface tibia
p1 = apex patella
p2 = tibial tuberosity
D – Distance for TTA
VD Thorax Measurement
– Measurement taken for the evaluation of cardiac size
Radiographic evaluation of cardiac size and subjective assessment of thoracic features is used in domestic animals as a primary diagnostic tool in the detection of heart disease and evaluation of its progression.
REQUIREMNTS
Required radiograph: ventrodorsal thoracic
HOW TO MEASURE
- Measure the long axis of the heart (L).
– Place first point pl1 on the ventral border of the left main stem bronchus (cranioventral border of the carina).
– Place second point pl2 on the cardiac apex (the most distant point on the ventral contour of the cardiac radiographic image).
- Measure the short axis of the heart (W).
– Place the points pw1 and pw2 at the widest point of the cardiac image on a line perpendicular to the long axis at the level of the caudal vena cava.
NOTE!
The line W is perpendicular to the line L, if the midpoint of this two axes is green – you can correct the position of these two lines until the point will be green.
- Measure the width of the thorax.
– Place the points pt1 and pt2 at the width of the thorax at the point where rib six articulates with the vertebral column (T).
- Measure the length of the clavicle.
– Place the points pcl1 and pcl2 at the length of the clavicle (C).
The following ratios are calculated:
L/W, W/T, W/C, L/C 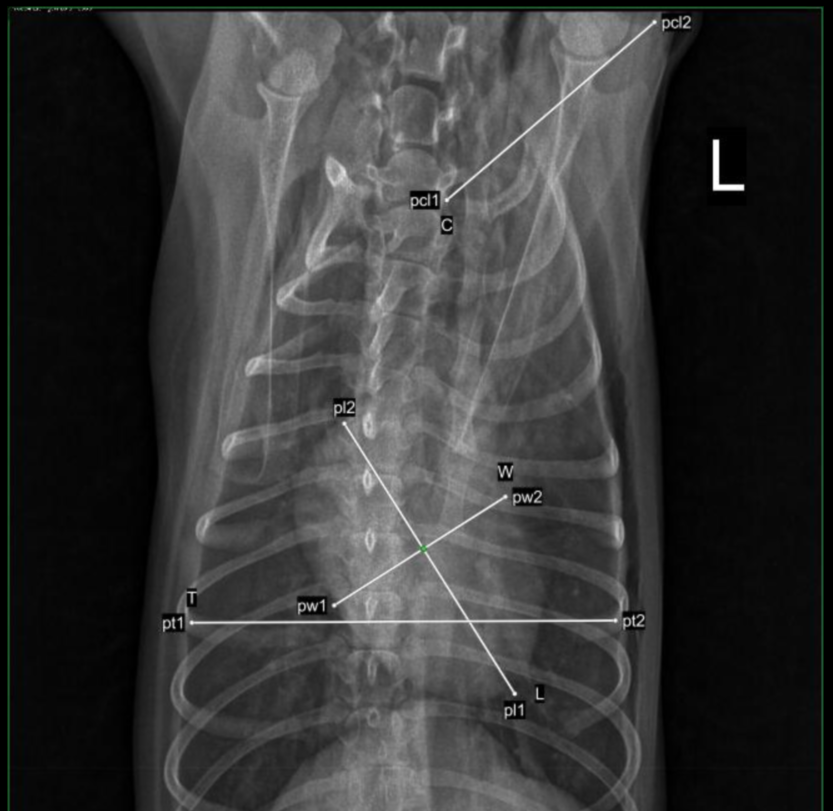

Figure 1. Cardiac size measurement
LEGEND
C = clavicle length
pcl1 = left clavicle facet manubrium sternum
pcl2 = acromial end clavicle
Vertebral heart size (VHS) measurement
– Vertebral scale system to measure heart size of dogs
REQUIREMNTS
Required radiograph: lateral thoracic
Positioning of animal: left lateral recumbency
Radiograph is taken during inspiration
Anesthesia is not necessary
X-ray beam to thorax must be perpendicular
HOW TO MEASURE
- Measure the long axis of the heart.
– Place first point pl1 on the ventral border of the left main stem bronchus (cranioventral border of the carina).
– Place second point pl2 on the cardiac apex (the most distant point on the ventral contour of the cardiac radiographic image). This dimension reflects the combined size of the left atrium and the left ventricle.
- Measure the short axis of the heart.
– Place the points ps1 and ps2 at the widest point of the cardiac image on a line perpendicular to the long axis at the level of the caudal vena cava.
NOTE!
To get an accurate measurement result of the VHS method, the lines pl1-pl2 and ps1-ps2 should be perpendicular (90°) or close to perpendicular to each other. In this case the green points appear on the lines. The redder the points are, the less accurate is the VHS measurement value. If the dots are red, no result is shown because of its inaccuracy.
- VHS (v) = pl1-pl2 (long axis) + ps1-ps2 (short axis)
The result is expressed in units of vertebral lengths (v). The sum of the measurements on both axes constituted the VHS and data are expressed as mean ± SD (standard deviation).
The two measurements (long and short axis) are compared to the vertebrae starting at the cranial edge of thoracal 4 (T4) and a result was obtained for each axis.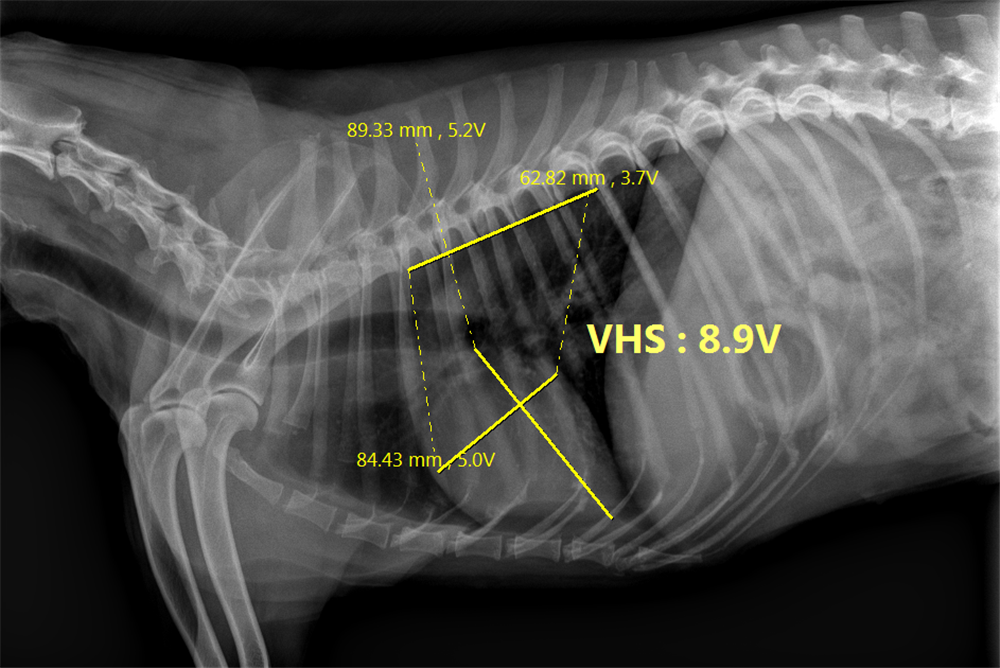
Figure 1. VHS measurement
LEGEND
pl1-pl2 => long axis heart
ps1-ps2 => short axis heart (=widest point perpendicular to long axis)
pl1 = ventral border of left main bronchus stem
pl2 = cardiac apex
ps1 = cranial heart wall (widest point)
ps2 = caudal heart wall (widest point) close to caudal vena cava
pv1 = T4 cranial edge thoracic vertebrae
pv2 = T9 cranial edge thoracic vertebrae
v = length of one vertebra
